The Chemistry add-in for Microsoft Word collects usage statistics to help us to support and understand how the add-in is being used. We collect a modest amount of data, including where in the world our users are, what version of Microsoft Word they’re using and what Operating System is being used. We have developed an automated process to generate the images below which show you some of the results that we can see.
Where in the world is the Chemistry addin for Microsoft Word used?
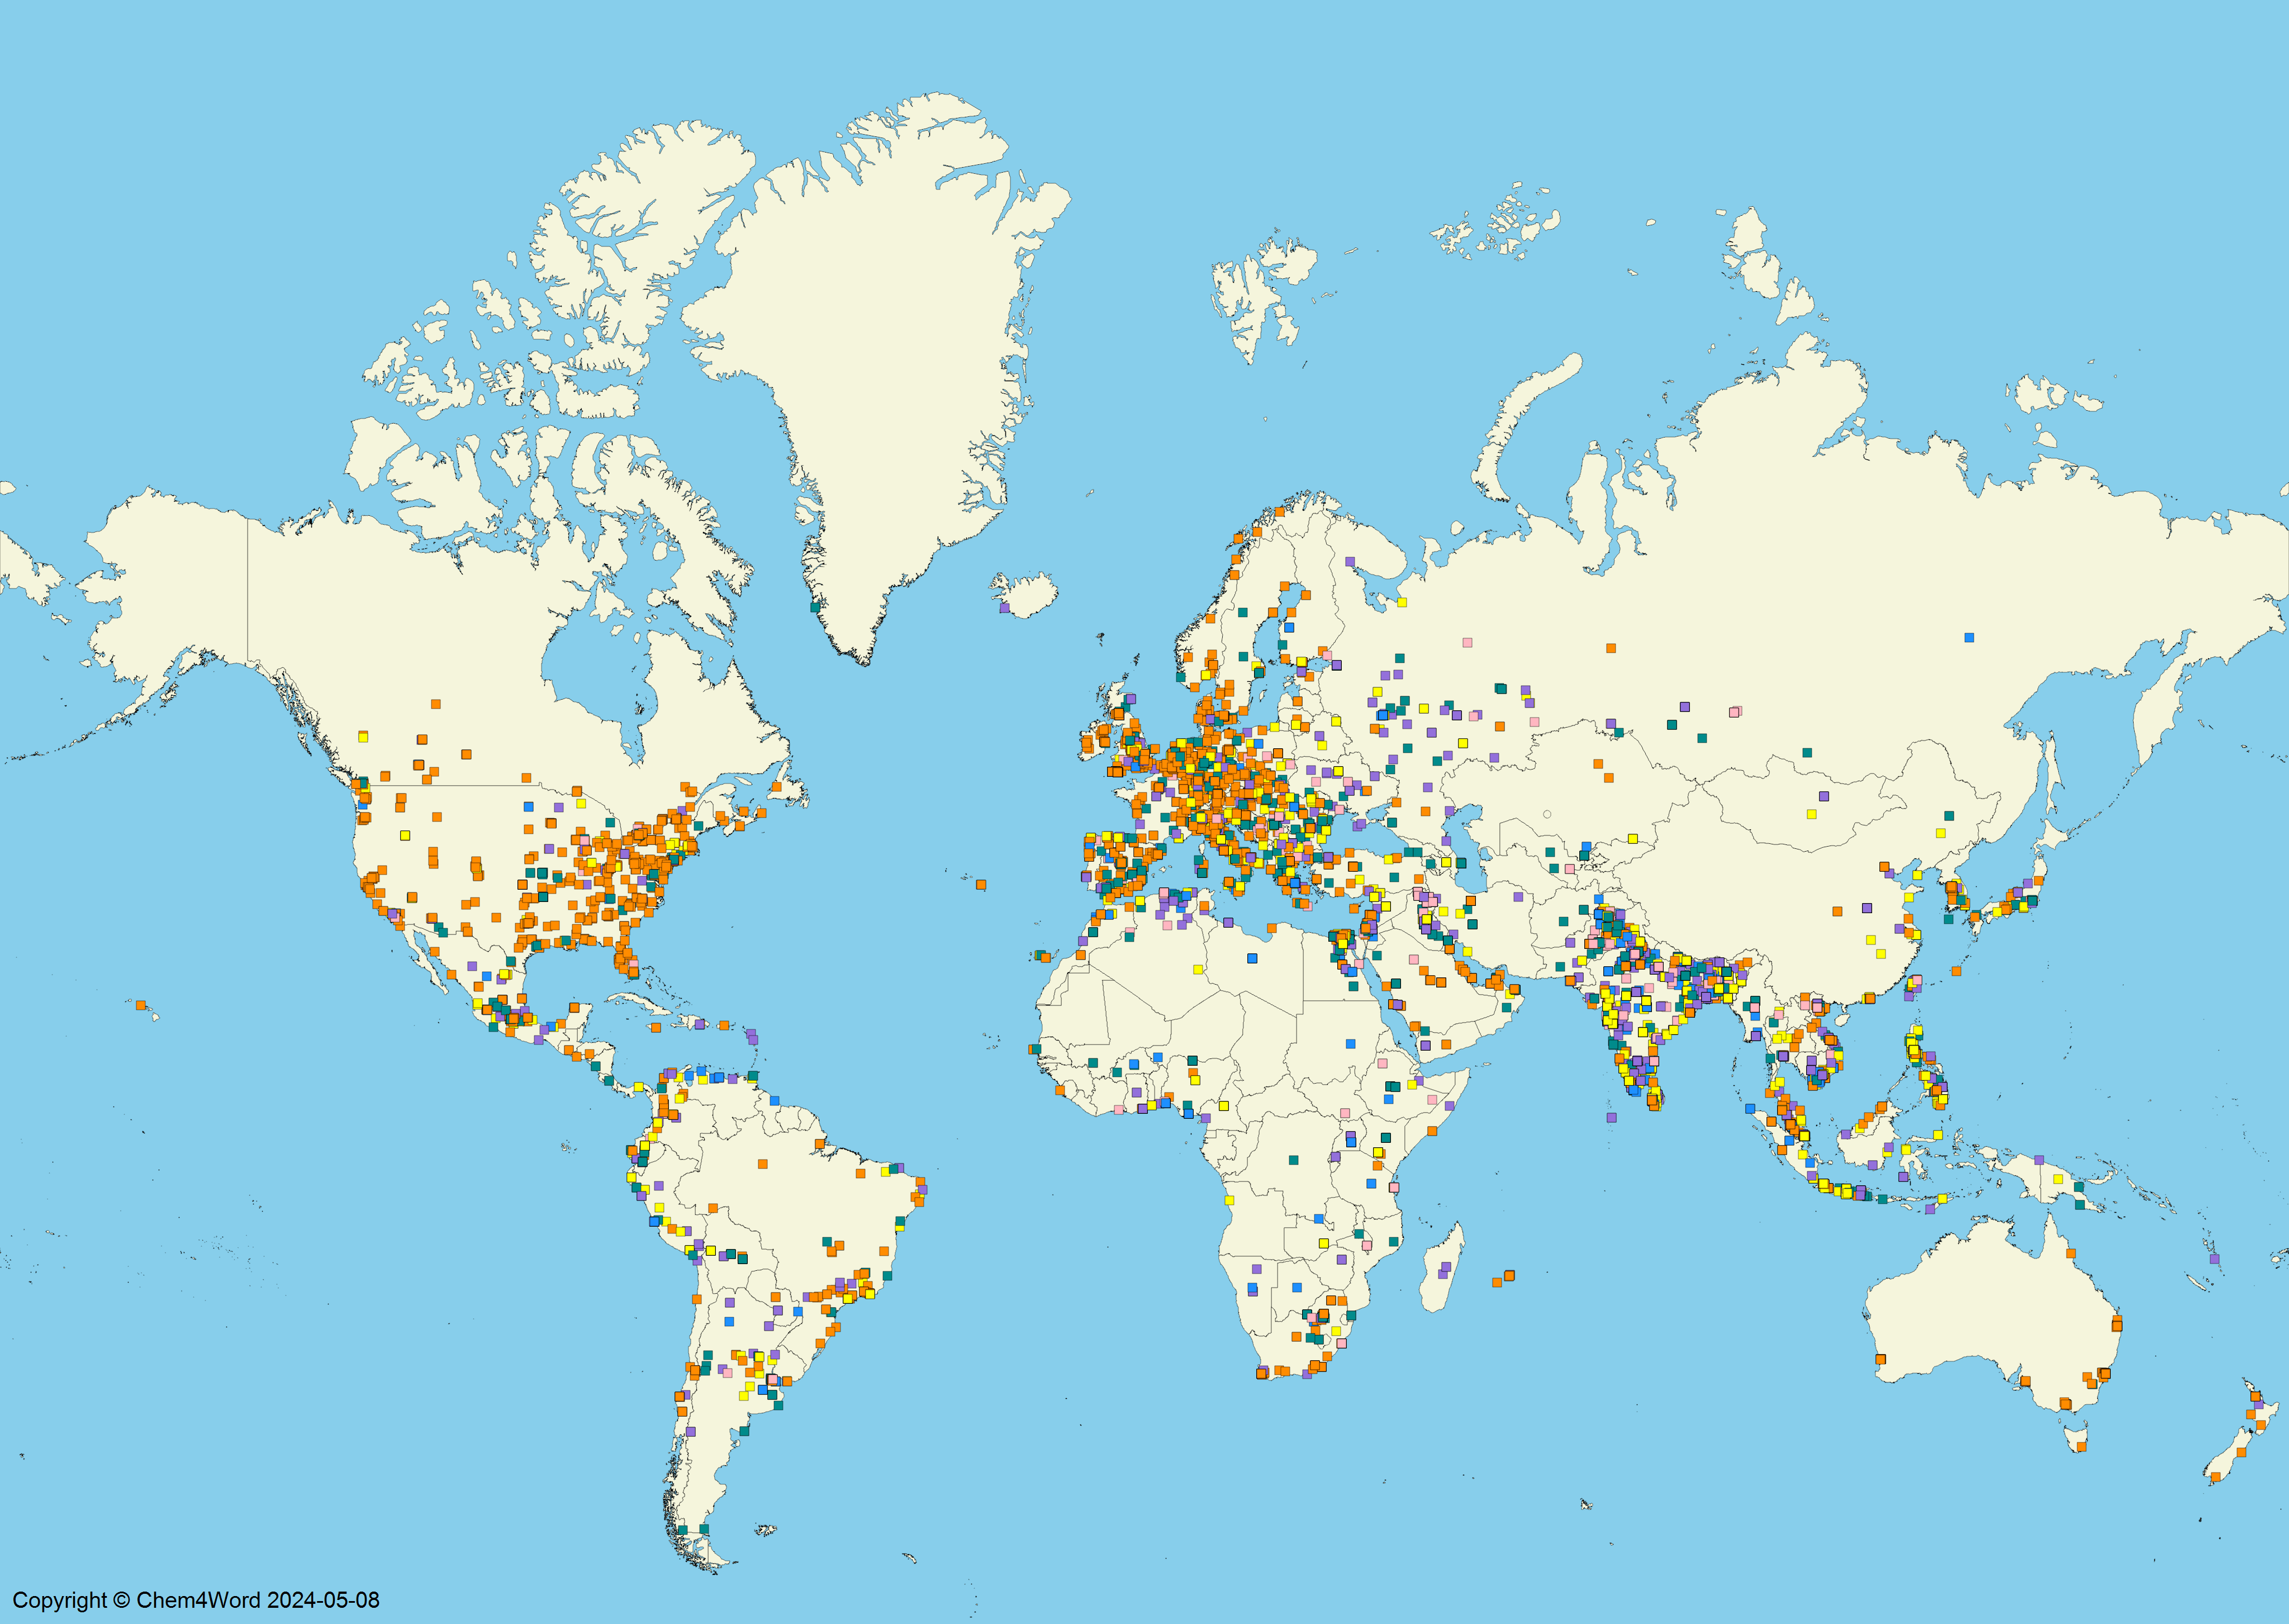
The individual dots are coloured according to the version of Microsoft Word being used. Click on the map to enlarge it.
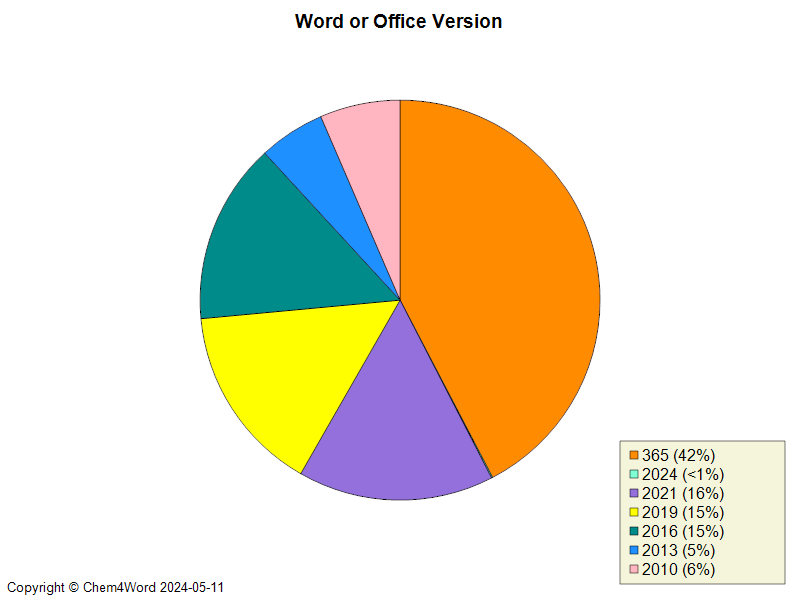
What version of Microsoft Word is used?
Using the same colouring above, you can see from the pie chart that the add-in is being used with all of the versions of Microsoft Word that we support. The new engine for generating the chemical structure graphics generates professional-looking structures.
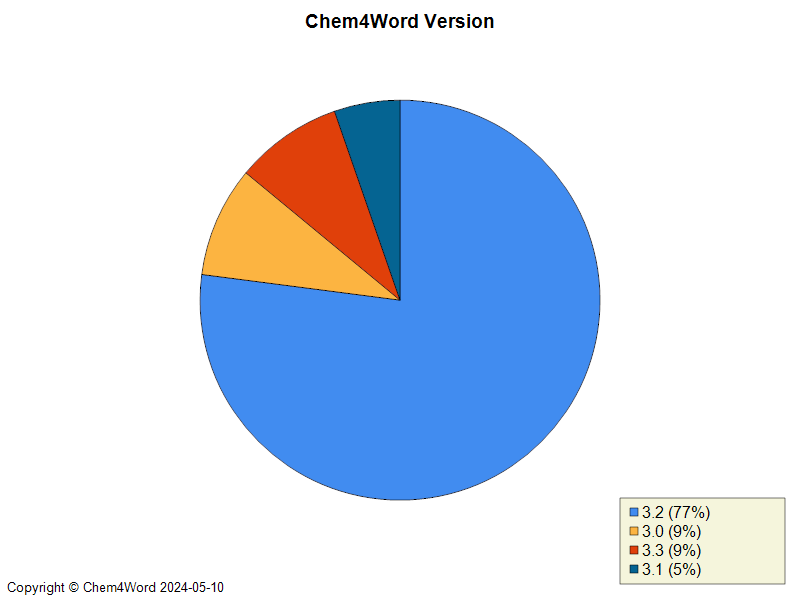
What version of Chem4Word is being run?
This chart shows the proportion of how many people are using each of the versions which are publicly available.
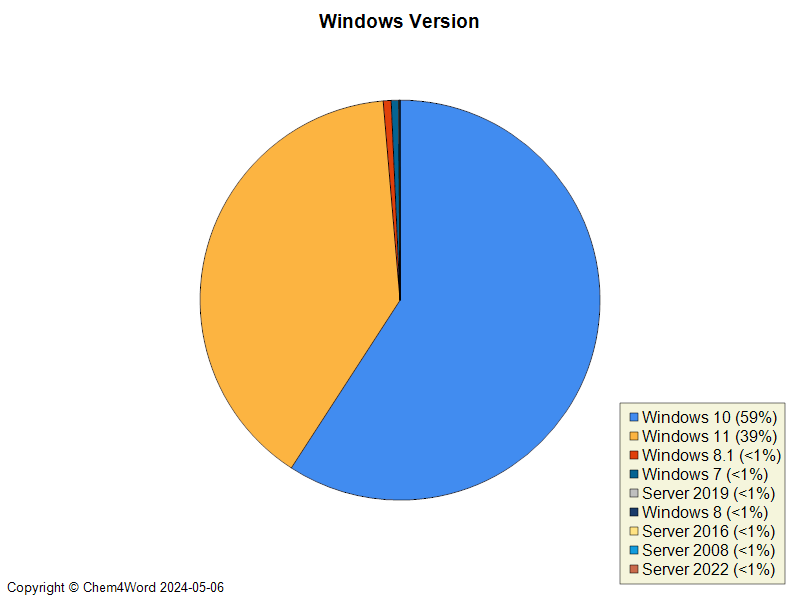
What version of Microsoft Windows is running?
An important piece of the jigsaw is the operating system being used. We have a very wide range of Windows versions on which the add-in is running. As you can see below, the majority of our users are on Windows 10 or 11.
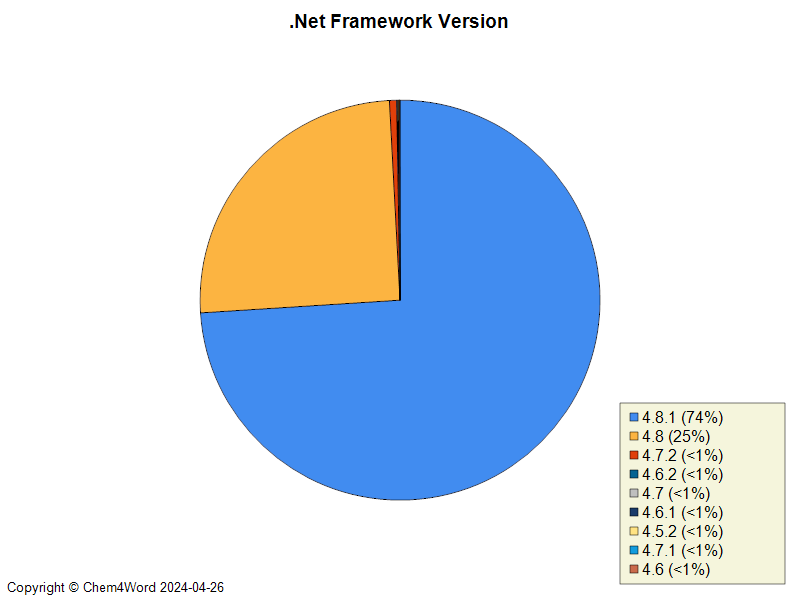
What version of Microsoft .Net Framework is running?
An important piece of the support jigsaw is the version of .Net Framework being used. As you can see the majority of systems have .Net Framework 4.8.1 installed.
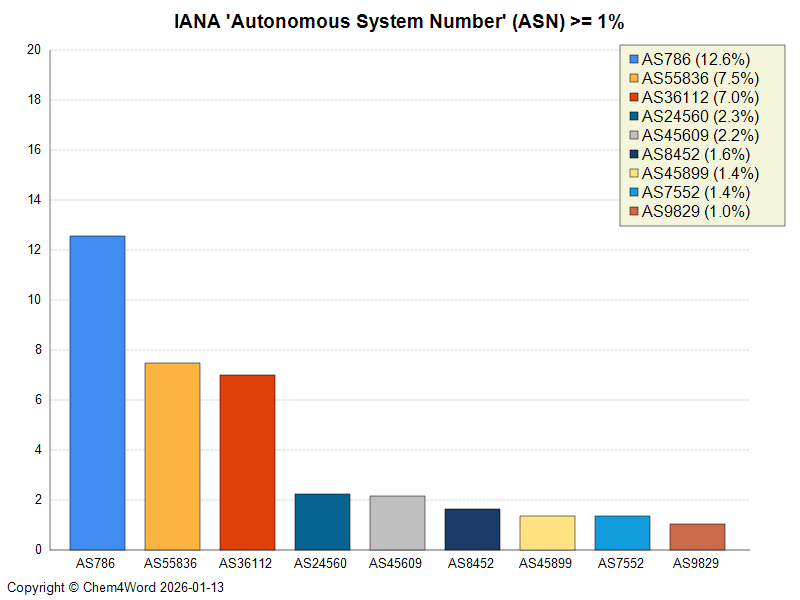
Which organizations are using Chem4Word the most?
Another piece of the support jigsaw is the autonomous system number (ASN) for each unique IP Address logged. This tells us that (as of February 2026) the three biggest organisations using chem4word are
- “The University of Plymouth” in the UK AS786
- “Park Hill School District” in Missouri, USA AS36112
- “Reliance Jio Infocomm Limited” an internet service provider in India AS55836
If you wish to find out more about an ASN you can form a link as follows
Take the AS above and replace it here https://ipinfo.io/{ASnnnn}
i.e. Here is the ASN link for google https://ipinfo.io/AS15169
Explanation from Wikipedia of AS(N)
“An autonomous system (AS) is a collection of connected Internet Protocol (IP) routing prefixes under the control of one or more network operators on behalf of a single administrative entity or domain, that presents a common and clearly defined routing policy to the Internet.[1] Each AS is assigned an autonomous system number (ASN), for use in Border Gateway Protocol (BGP) routing. ASNs are assigned to local Internet registries (LIRs) and end-user organizations by their respective regional Internet registries (RIRs), which in turn receive blocks of ASNs for reassignment from the Internet Assigned Numbers Authority (IANA). The IANA also maintains a registry of ASNs which are reserved for private use (and should therefore not be announced to the global Internet).”